Thursday, 23 January 2020
The MIBI received 2,540 claims relating to uninsured or untraced incidents in 2019.
We have broken down the number of claims on a county by county basis. You can read the specific figures by clicking below>>>
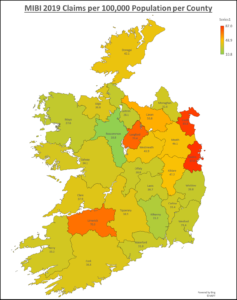
To provide a more visual understanding of the concentration of claims received by the MIBI, we have created this heatmap which analyses the number of claims submitted per county per 100,000 of the local population.
As the heatmap scale shows, those with the highest concentration of claims per capita are in red, while those with the sparsest claims per capita are in green